Redding Area Bus Authority#
About These Maps:#
Each map shows bus (and rail, if applicable) speeds for Redding Area Bus Authority, with a map each for the morning peak, midday, and afternoon peak periods on November 15 2023 (Wednesday).
On the map, routes are split into segments corresponding to the distance between two stops, allowing you to focus on specific portions of the route experiencing a slowdown.
Route segments are arrow-shaped to indicate direction of travel. Thicker segments indicate more frequent transit routes.
State Highway Network routes are outlined in gray.
Hover over, a segment with your mouse to see the exact speed, route name, and transit service frequency in that segment.
Higher-frequency routes (3+ trips per hour) are especially important, since those slowdowns correspond to more vehicles, and riders, delayed in traffic.
Morning Peak#
Variation in Speeds by Segment#
This visualization shows variation as the ratio between the 80th percentile and 20th percentile speeds in each segment
Segments with high variation in speeds make it difficult for transit operators to set accurate schedules, and can cause inconsistent service for riders
Midday#
Variation in Speeds by Segment#
This visualization shows variation as the ratio between the 80th percentile and 20th percentile speeds in each segment
Segments with high variation in speeds make it difficult for transit operators to set accurate schedules, and can cause inconsistent service for riders
Afternoon Peak#
Variation in Speeds by Segment#
This visualization shows variation as the ratio between the 80th percentile and 20th percentile speeds in each segment
Segments with high variation in speeds make it difficult for transit operators to set accurate schedules, and can cause inconsistent service for riders
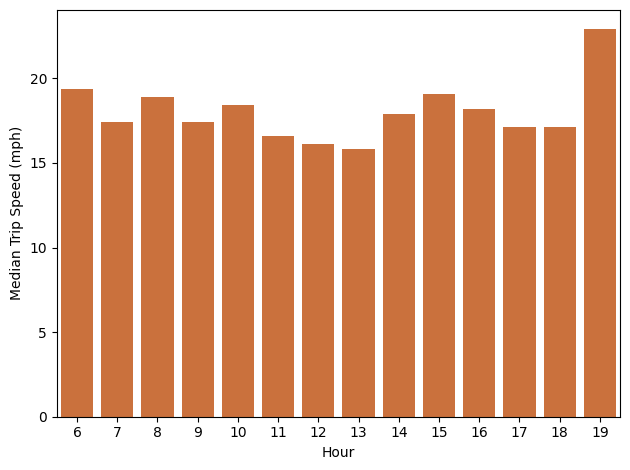
Daily Speed Patterns#
This chart shows the distribution of median trip speeds throughout the day. It can help find times of day where transit riders experience the slowest overall speeds.
Median Trip Speed by Hour of Day, All Route Types, All Routes, 06:00–22:00, Nov 15, 2023 (Wed)